Strava, the social network for athletes, has today revealed intriguing insights into the habits and achievements of Virgin Money London Marathon runners by releasing data from over 10,000 runners who completed the 2017 edition and uploaded their activity to the app.
Pacing
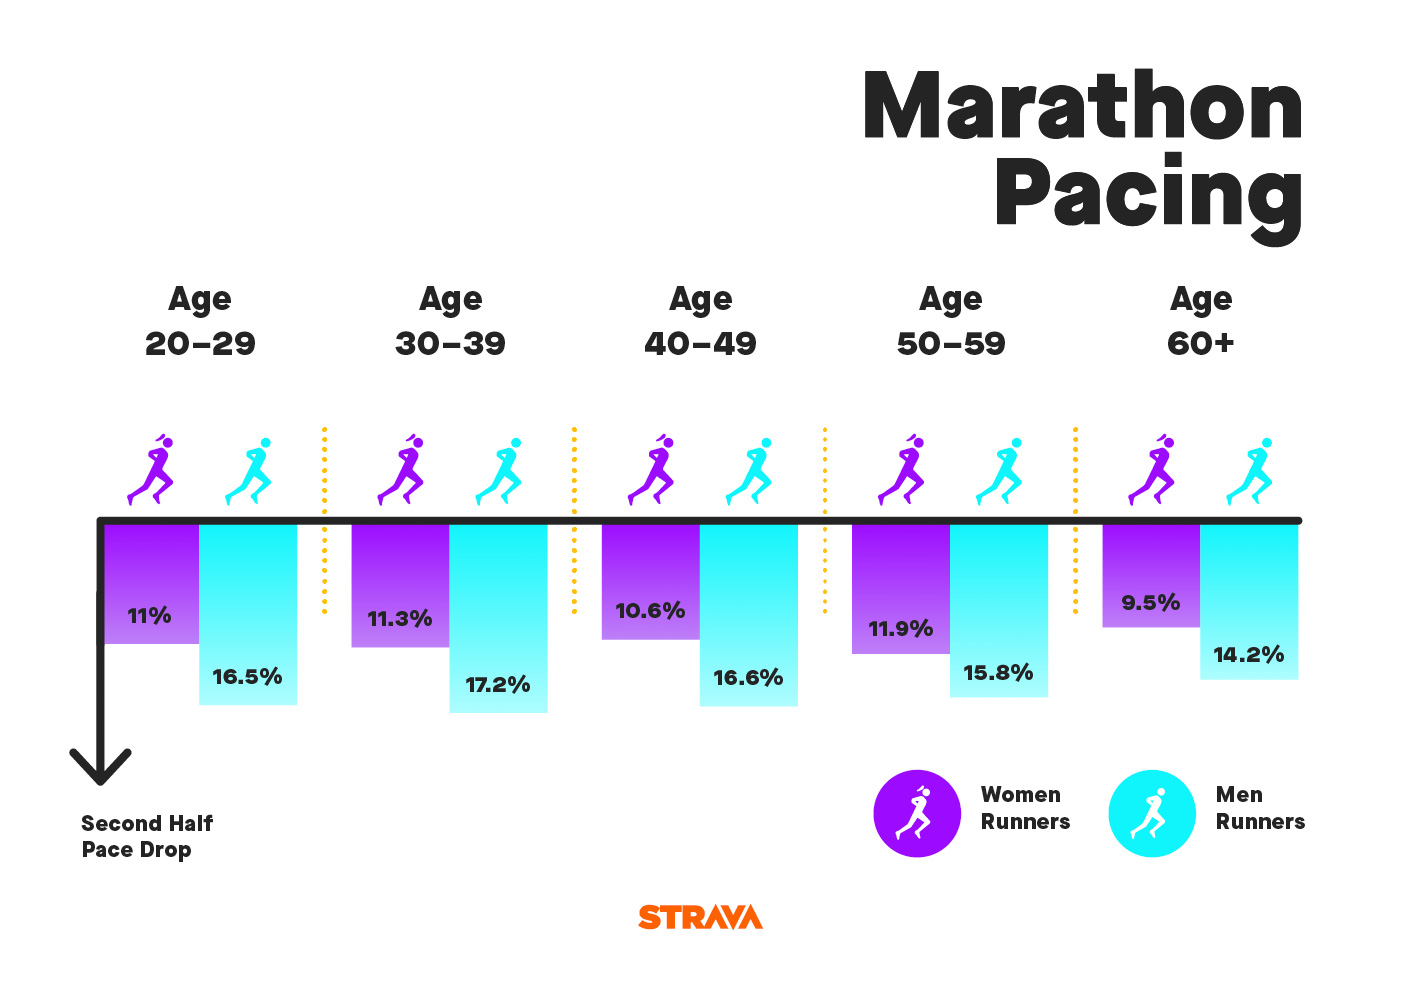
Women are significantly better than men.
Older runners are more consistent at pacing. The very best pacers are women over 60.
Training
51-60-year-olds were the most committed age group in training (371 miles over 13 weeks pre-marathon).
21-30-year-olds were the least committed in training (311 miles over 13 weeks pre-marathon = over 16% less).
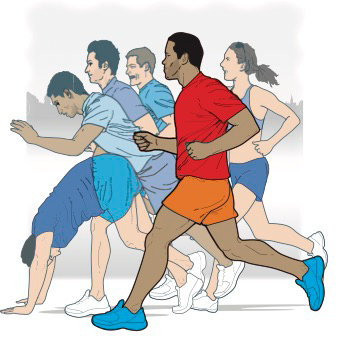
Mr Average
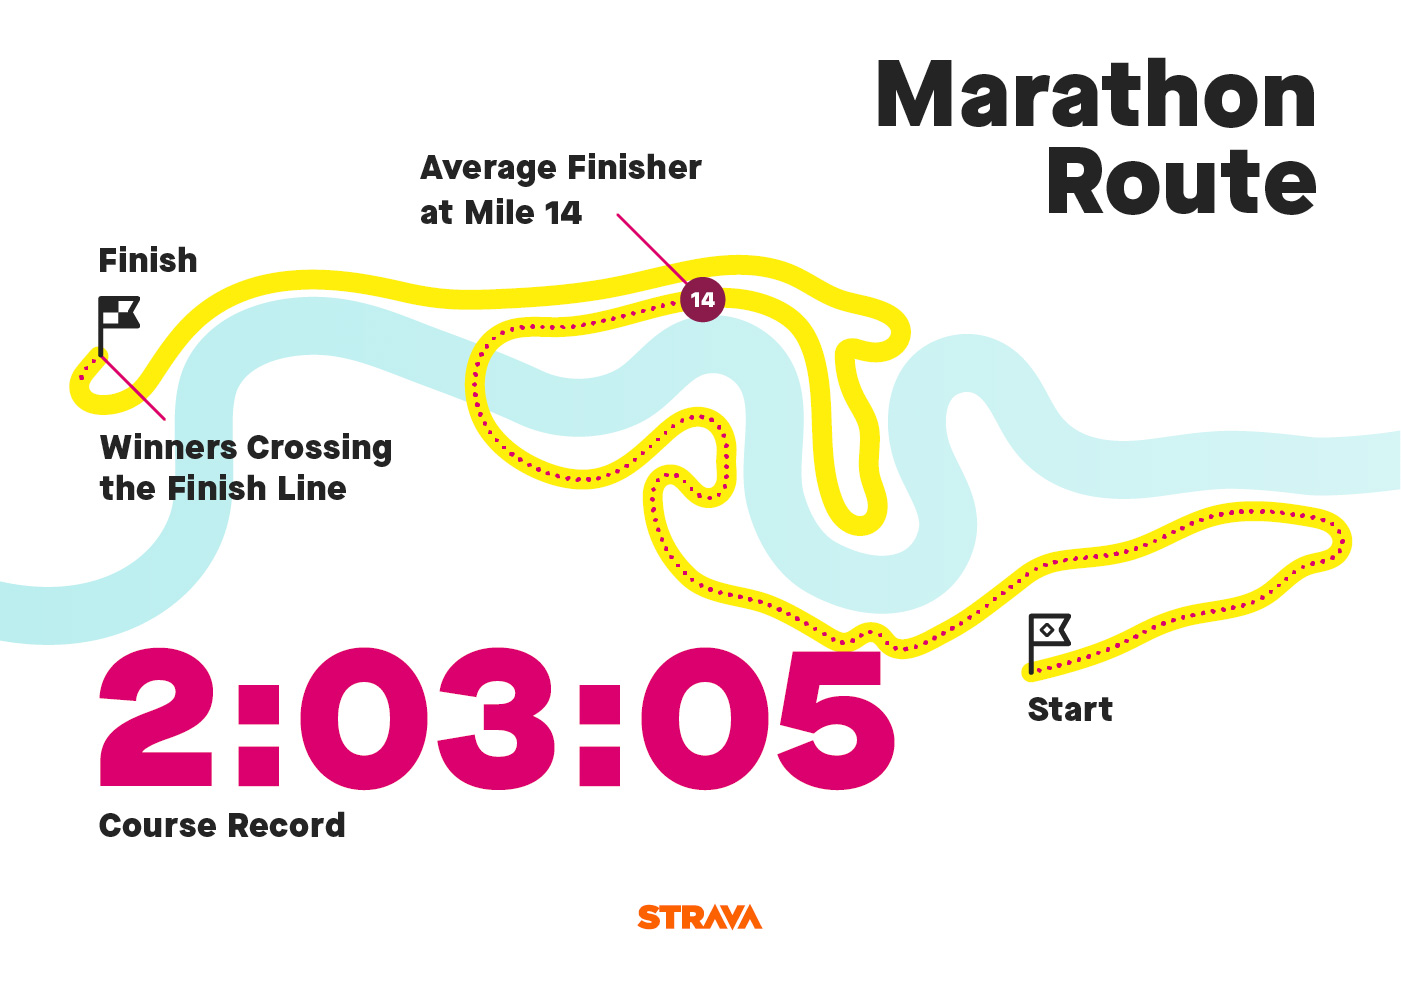
The average finisher would only be at mile 14 when the winners cross the line.
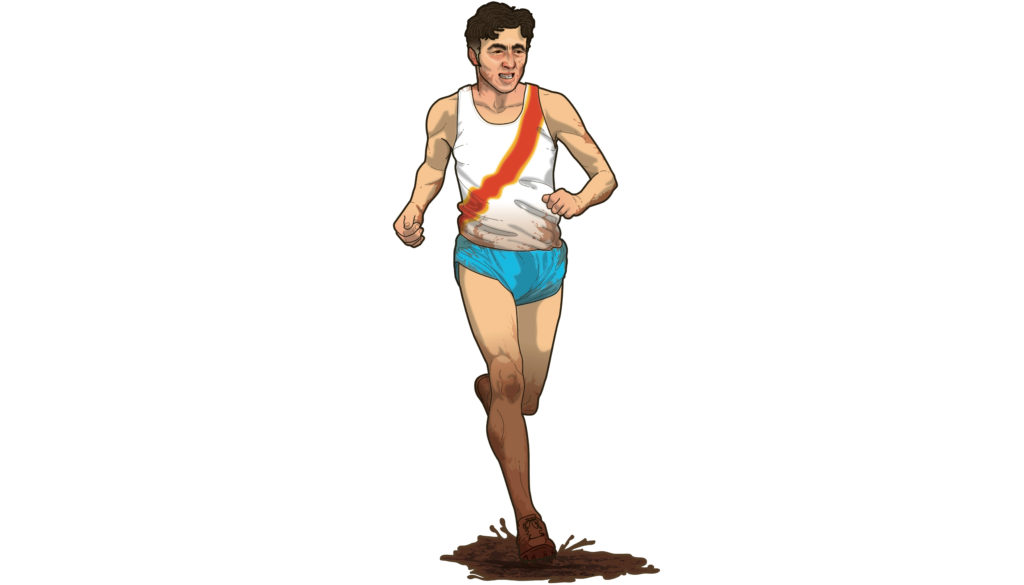
‘The Wall’
Runners hit ‘the wall’ during Mile 25. It was the slowest mile of the 2017 London Marathon.
London Marathon Stats
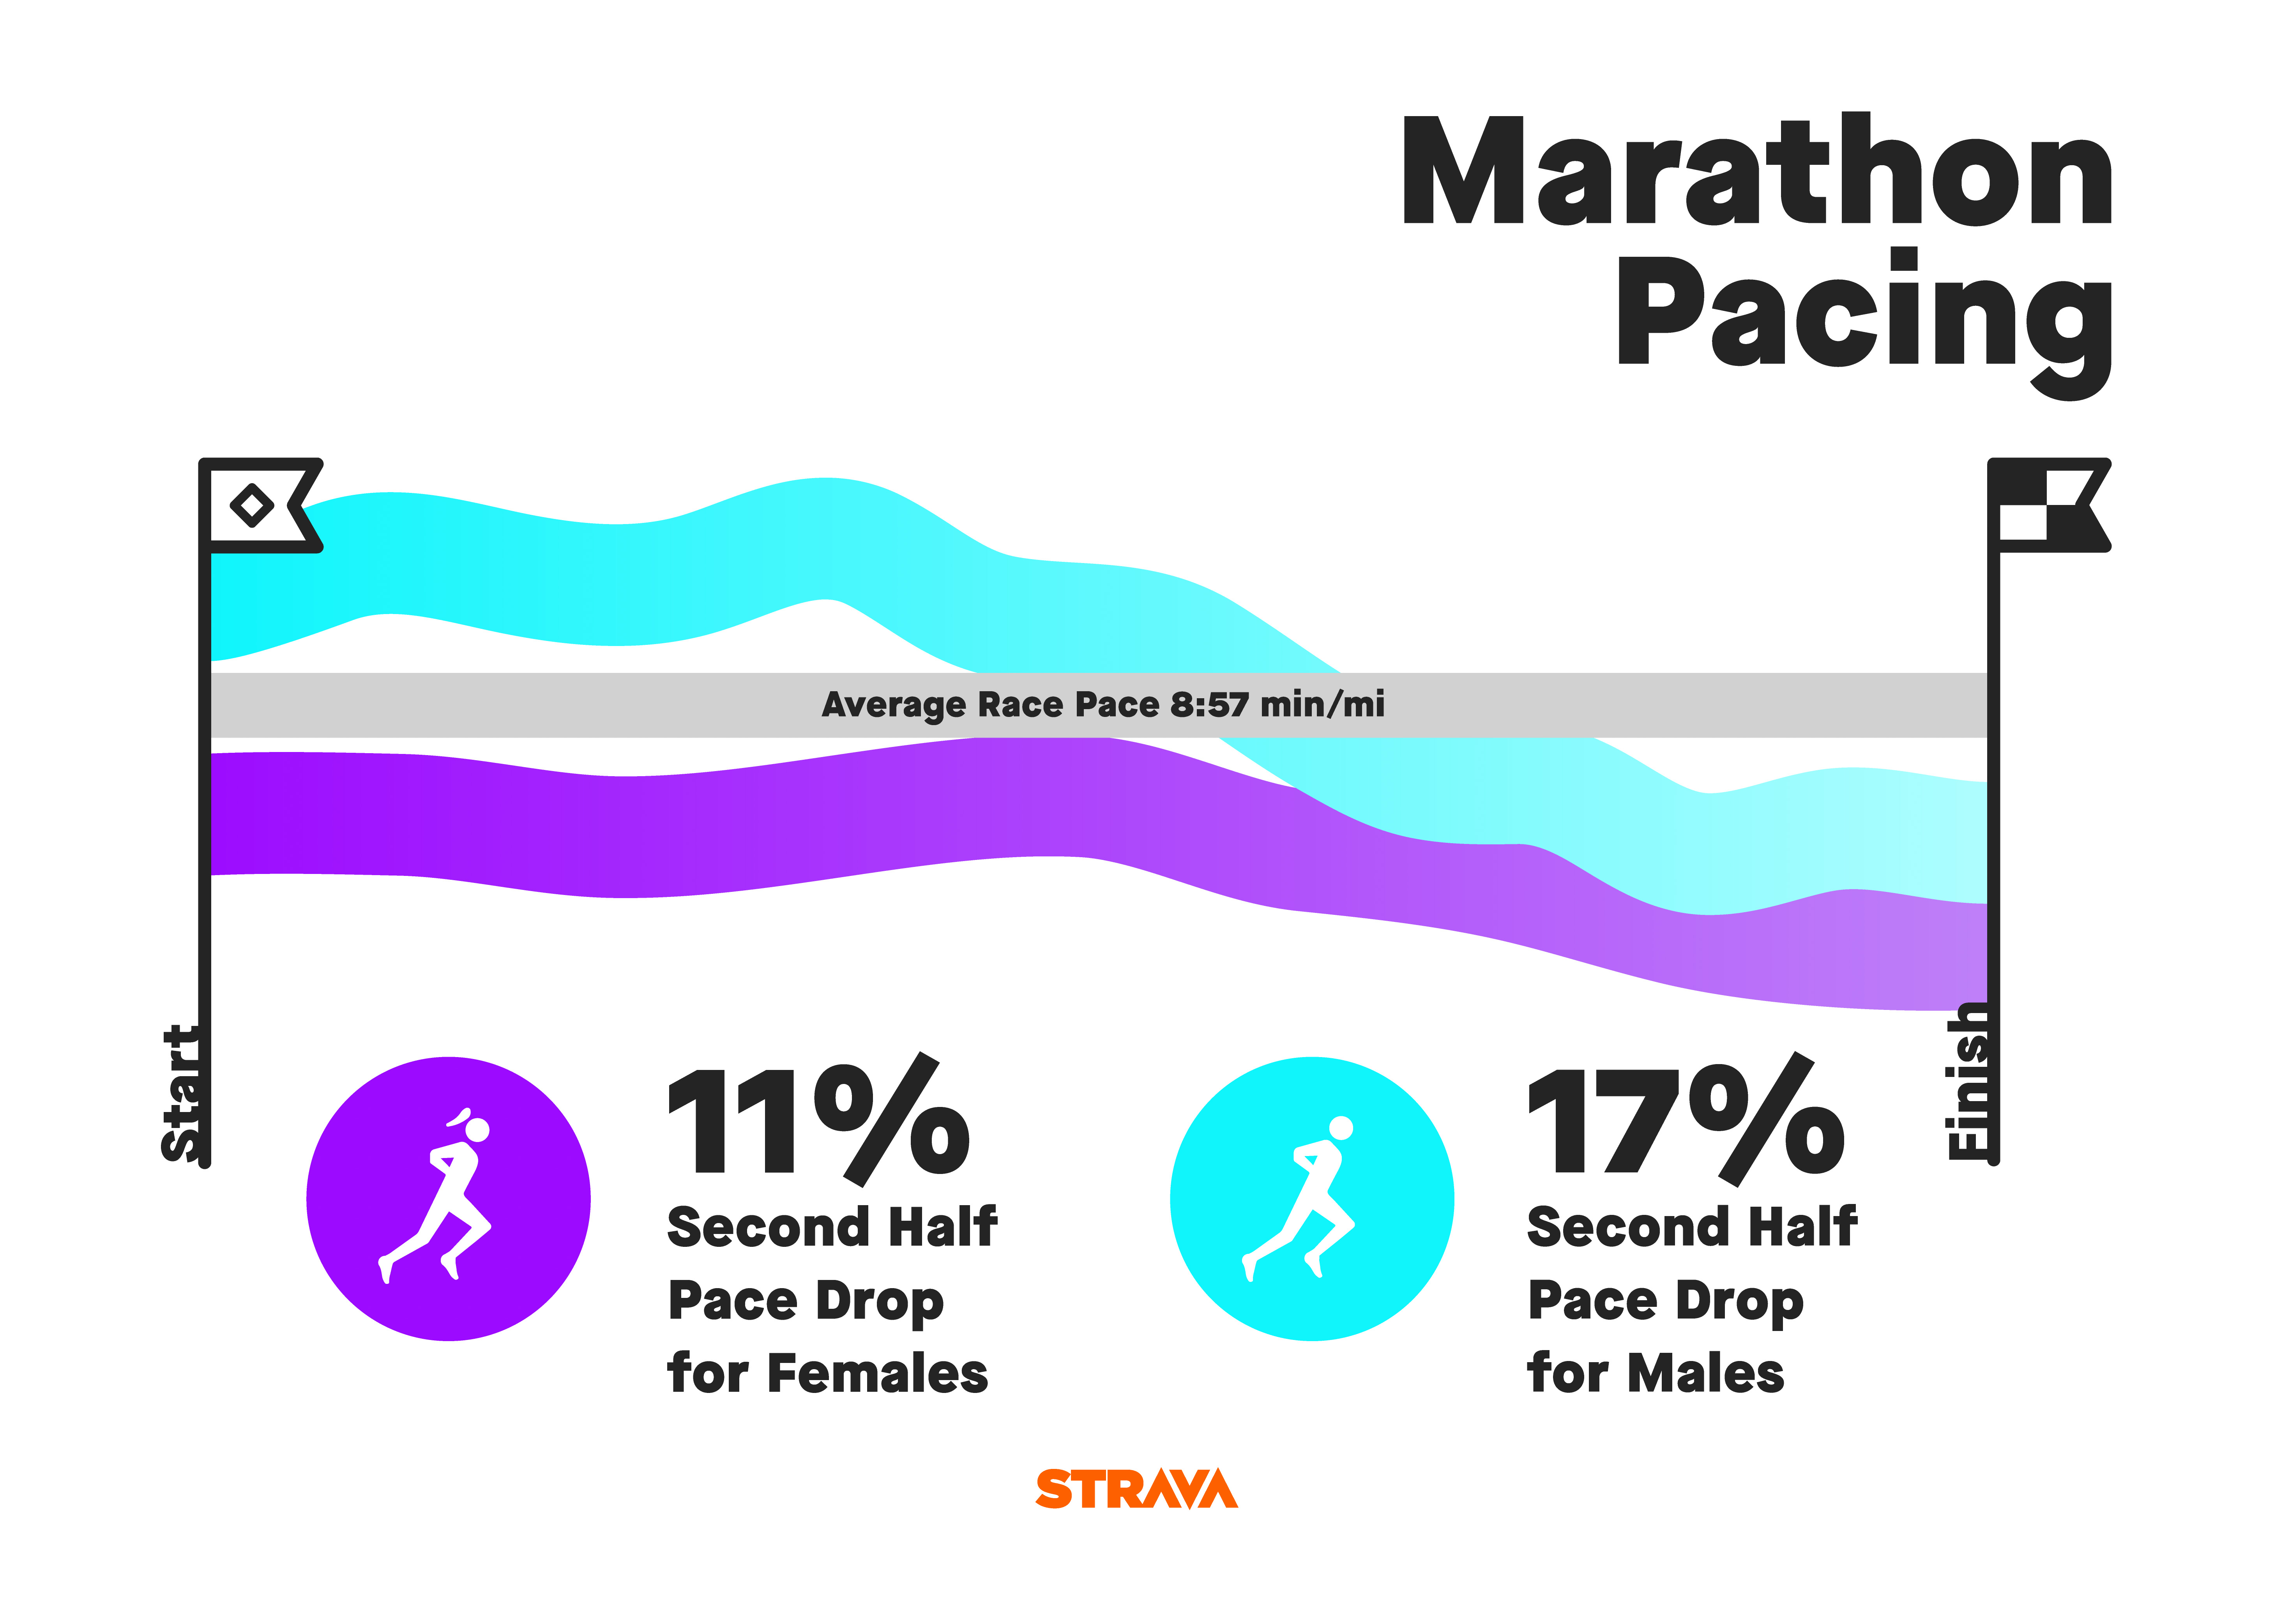
The data, taken from the uploaded activities of 10,706 runners – some 25% of the field – clearly shows that women are significantly better at pacing a marathon than their male counterparts.
Comparing the pace at which runners completed the first half of the marathon to their pace in the second half it was discovered that, on average, women only slowed by 11%, while men dropped off more dramatically: slowing by 17%.
This would suggest that men have a tendency to set off too fast and pay for their early effort later in to the race whereas women race smarter, maintaining a more consistent pace throughout.
The Strava data also revealed that women over 60 were the most consistent at pacing their effort, with only a 9% variance in pace.
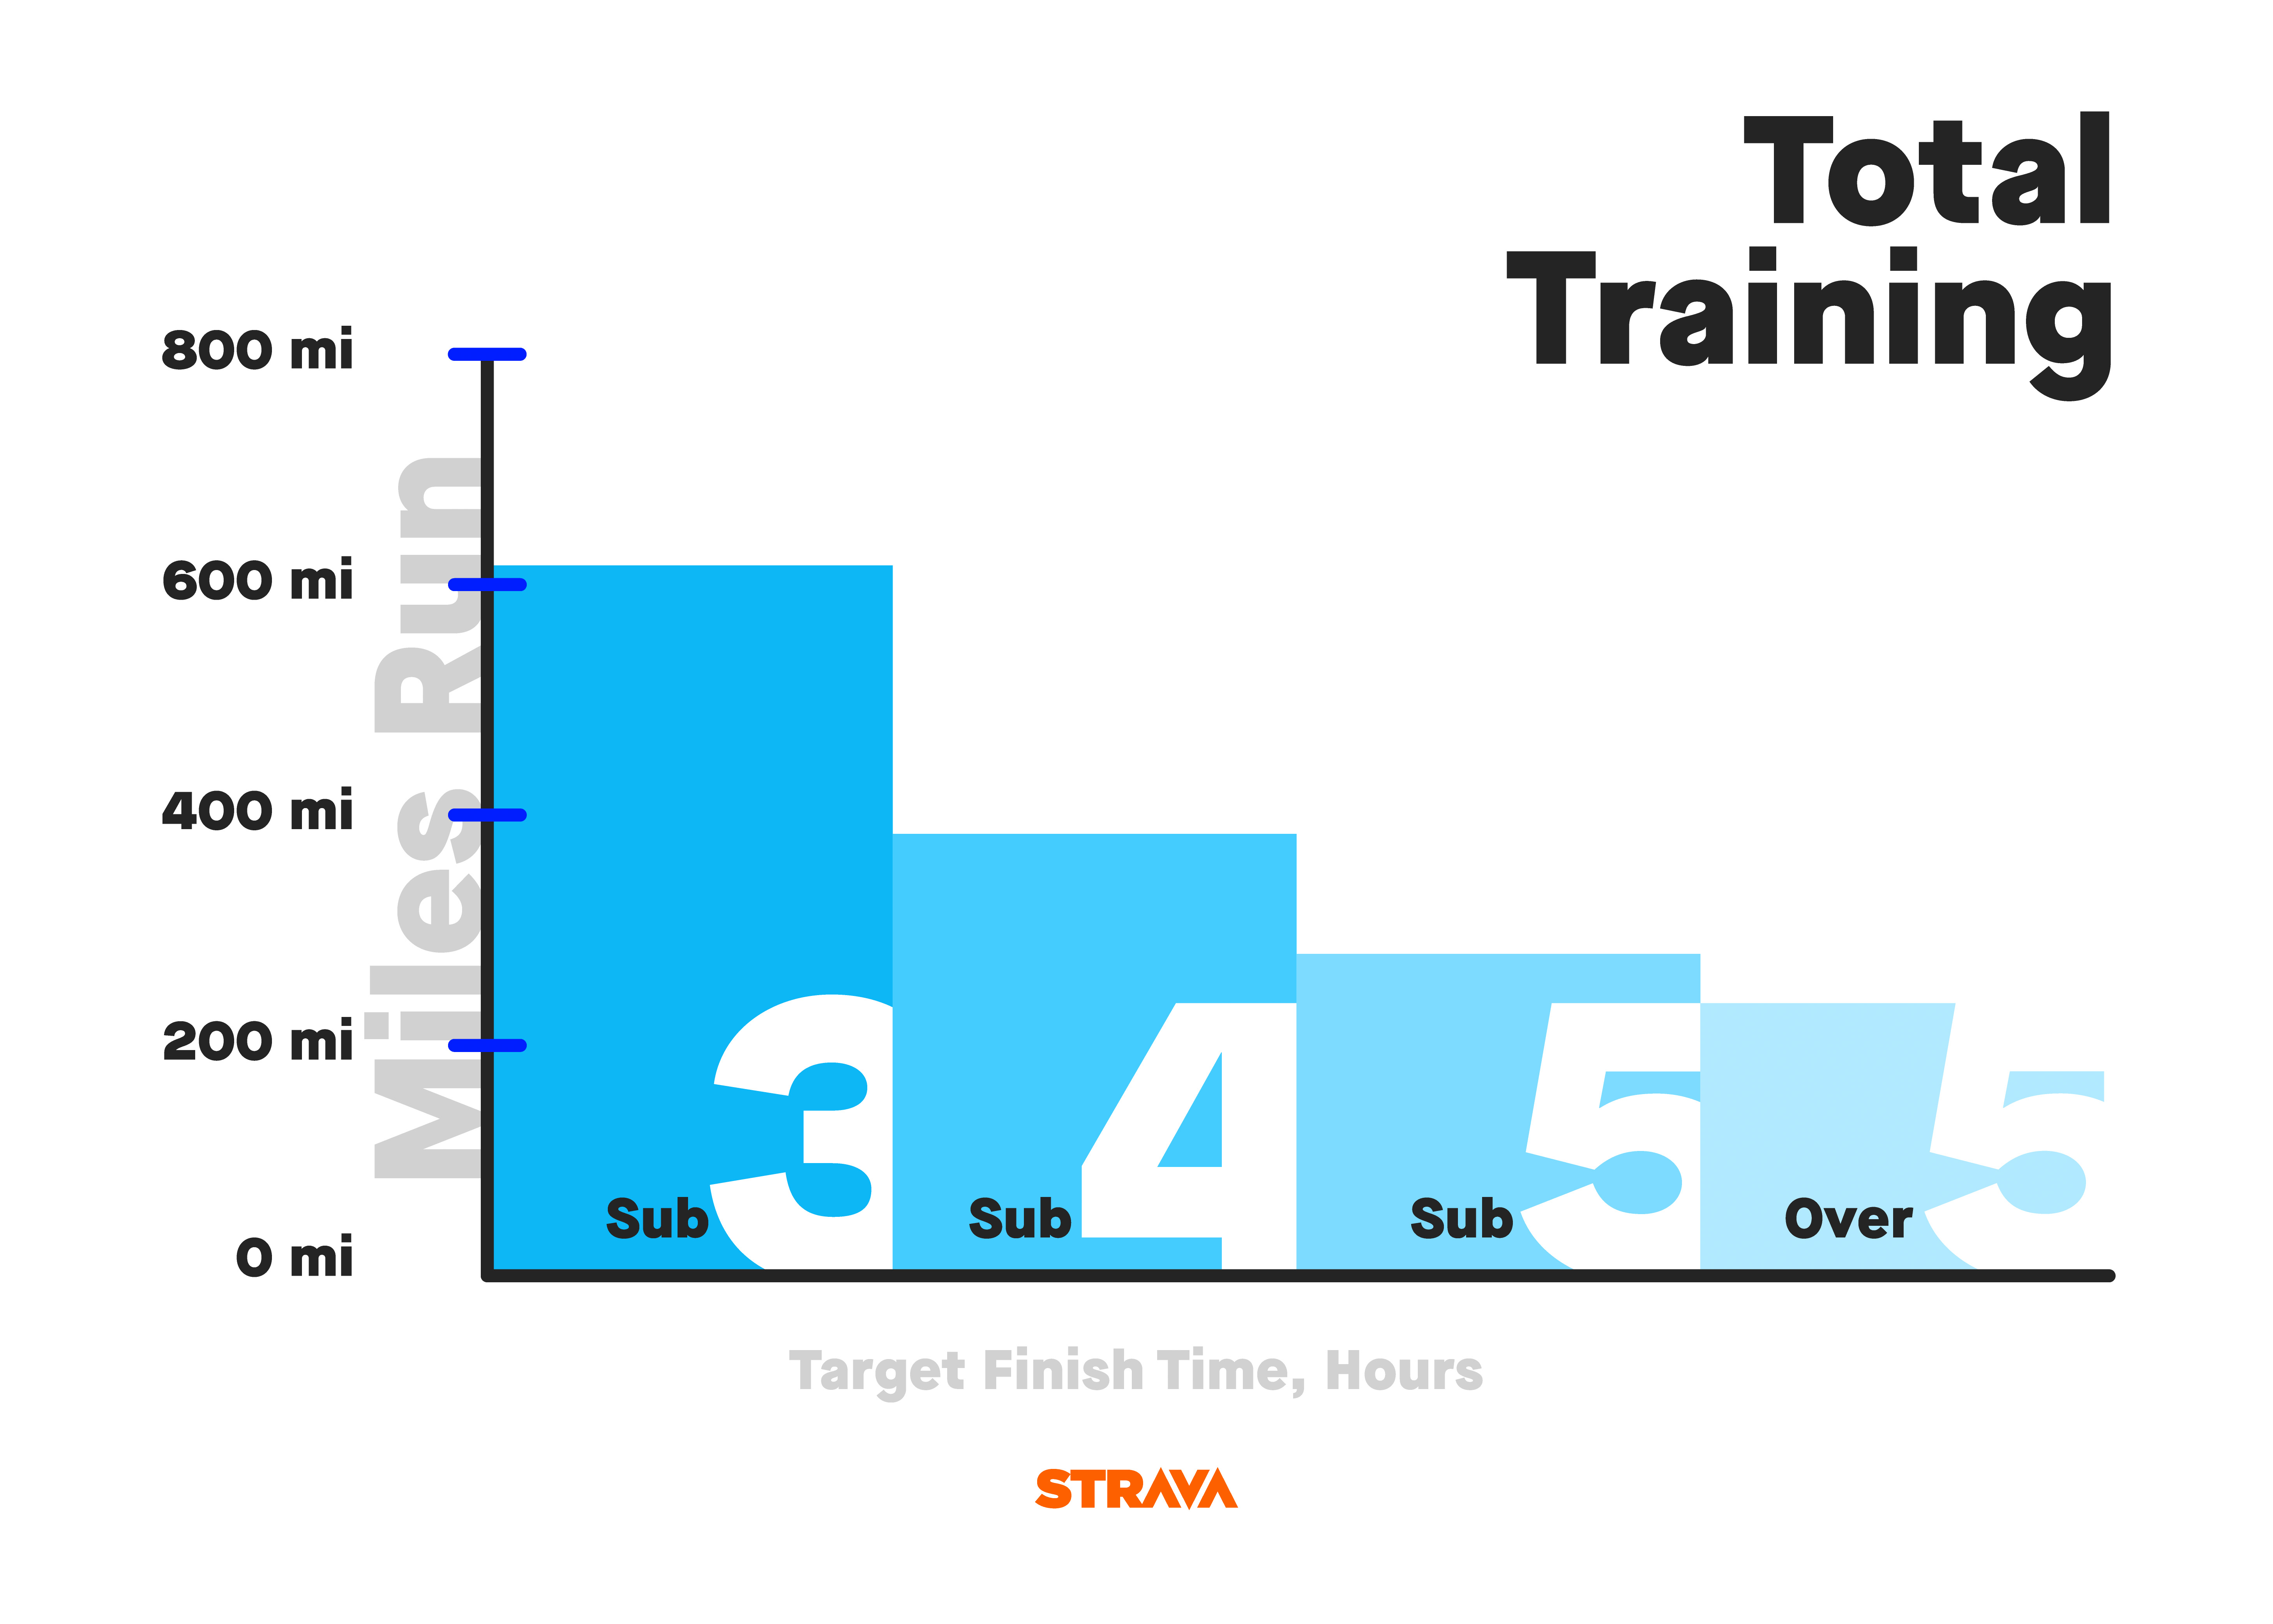 51-60 year old runners clocked up the most mileage in the 13 weeks leading up to the London Marathon, averaging 370.9 miles total, getting out for 3.9 runs per week. At the other end of the scale, 21-30 year olds only ran 310.7 miles, spread over 3.4 runs per week; perhaps relying on their youth and shorter training runs to see them across the finish line.
Across all age groups, the more training runners put in during the 13 weeks prior to the event the faster they ran. This offers clear evidence that there really is no substitute for putting in the hard graft and getting the miles in.
Runners breaking the 3-hour barrier clocked over 600 miles in training.
How do average runners compare to the world elite?
The Wall
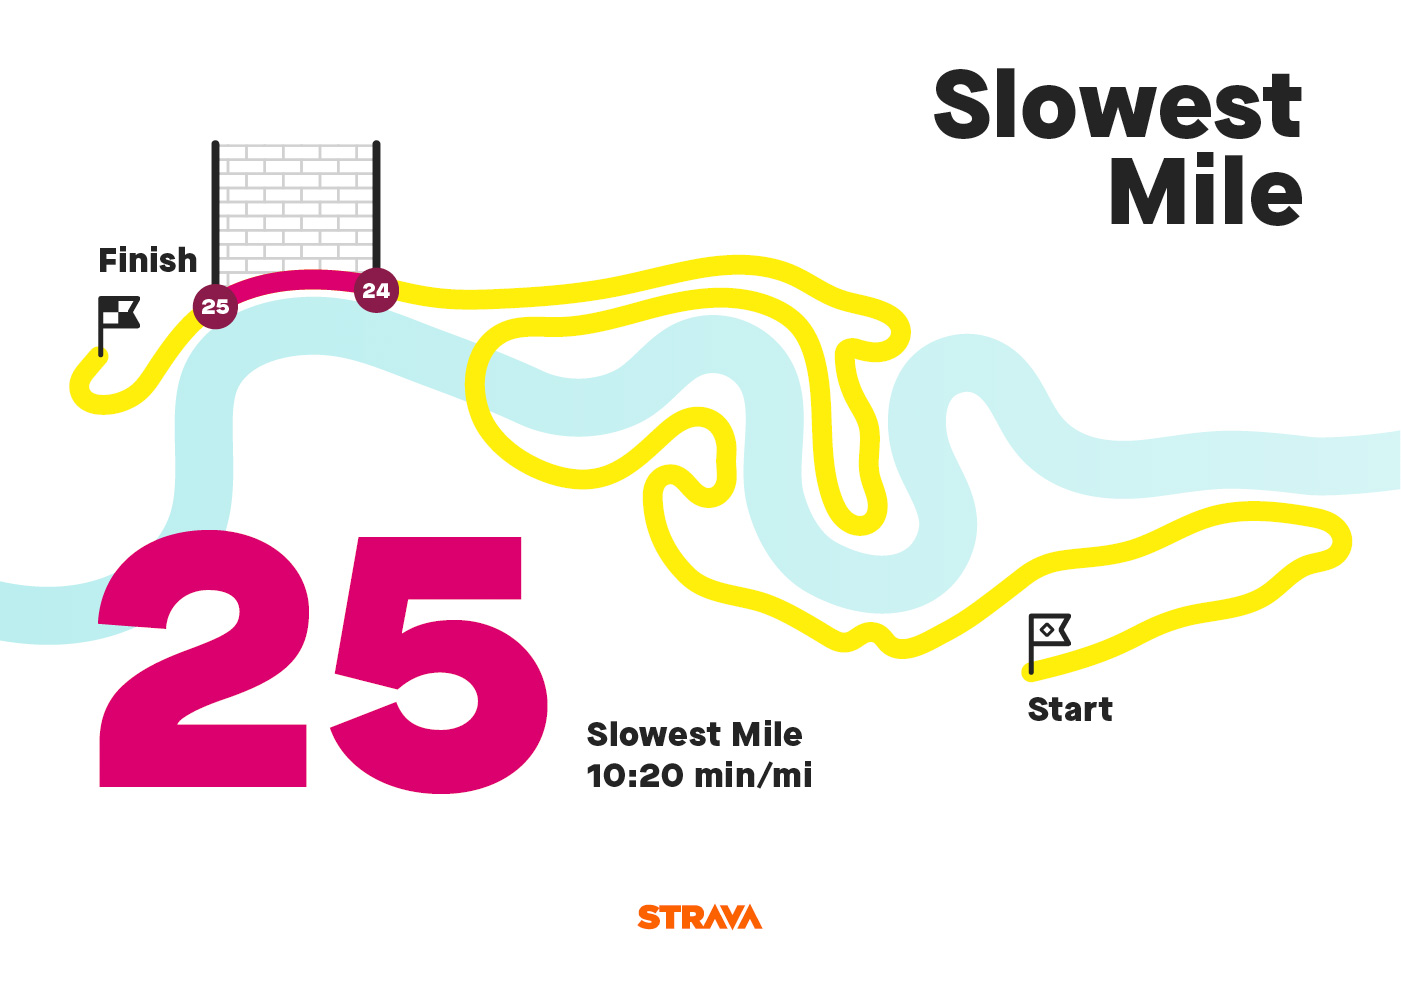
The mile at which most runners achieve their slowest split, known as ‘hitting the wall’, comes in the second half of the Marathon at Mile 25. It was here that, on average, runners slowed to a pace of 10:20min/mile: over 1 minute 40 seconds slower than mile 7 (the fastest mile) which was raced through at an average pace of 8:48min/mile.
Across all age groups, the average finish time for men was 3 hrs 39 mins, with the average finish time for women being 4 hrs 17 mins.
Many dream that they could hold their own against the elite but just how much faster are the top athletes than the average Strava London Marathon runner?
As the winner crosses the line in 02:03:05 (the course record), the average runner will only be hitting Mile 14 near Limehouse, a good 12 or so miles behind the race winner.
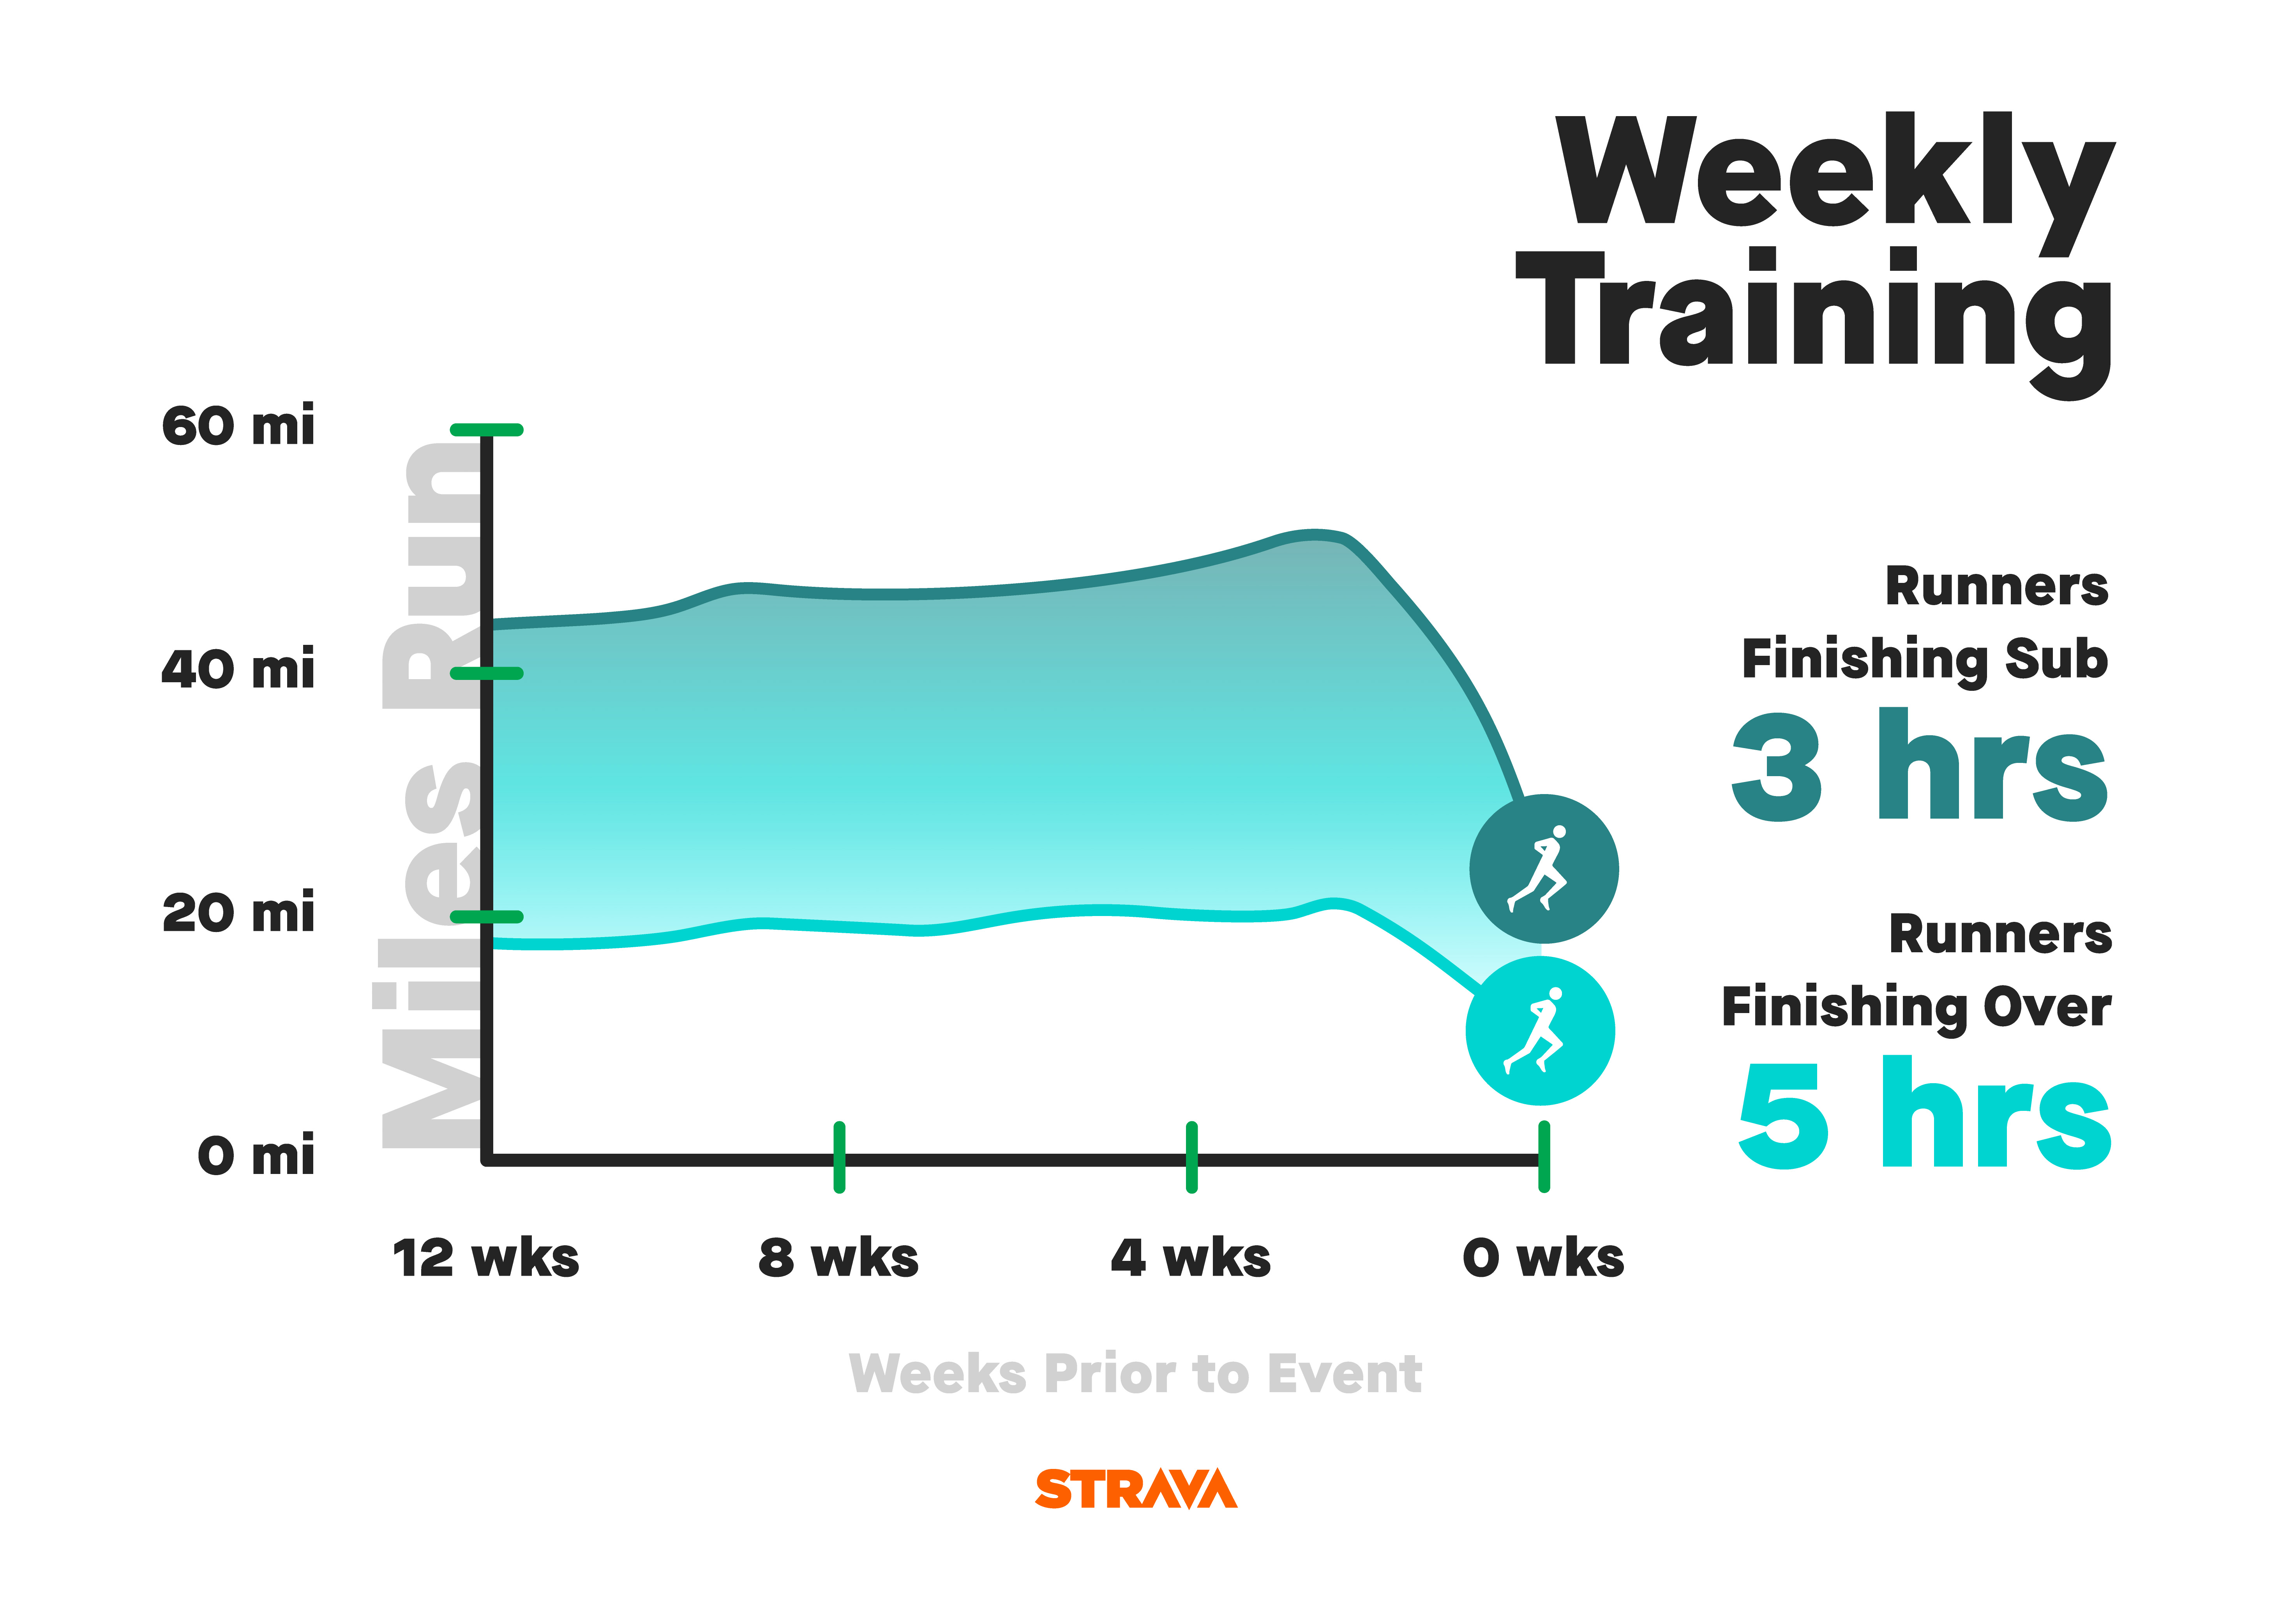
It’s well known that tapering ahead of a big event and giving your body time to recover and adapt to your training can be beneficial. This is reflected in Strava’s data.
Peaking at an average of 31.4 miles three weeks out from the London Marathon, athletes only covered 27.1 miles two weeks out and 21.3 miles one week out.
In the week of the London Marathon, athletes only clocked up an average of 10.3 miles – presumably to keep the legs moving while they focusd on carb-loading – running some of their slowest training sessions of their entire training with an average pace of 8:35min/mile.